When doing economic evaluation you often need to forecast into the future. And when projecting about earnings, you need to account for changes in the economy (for example, inflation). I am currently working on a study examining productivity losses associated with cancer in Ireland, and need to account for wage growth in the future. But how do you do this when the economy is as uncertain as the current situation in Ireland?
Wage growth: This Wall Street Journal blogpost describes wage growth as one of the key indicators of economic health (as well as some of the current problems with wage growth in the US). In Ireland there are similar economic woes, but future predictions of the real wage growth rate are harder to come by. Instead, people have used the Gross National Product (GNP) percentage change per year as a proxy for wage growth. GNP is the total value of all products and services produced by residents of a country over a particular period of time. Previous work similar to mine (Hanley 2012 & Hanley 2013) has used older versions of these predictions, which estimated an average growth rate of 2.6%.
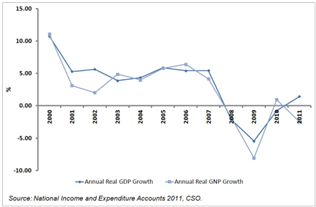
GNP in Ireland: At the height of the Celtic Tiger period (mid 1990’s to mid 2000’s) GNP in Ireland was over 5%, however in the period 2007 to 2012 the growth rate of GNP in Ireland has been -2.2%. The Economic and Social Research Institute (ESRI) propose that this was due to the global financial crises causing the Irish housing market to crash. This in turn led to collapse of the construction and banking industries, resulting in Ireland entering a period of recession. This period has been characterised by high levels of state debt and unemployment.
GNP growth projections: According to the latest report from ESRI, the GNP growth rate in coming years will be dependent on a number of factors, particularly the recovery of the EU economy, domestic policy decisions and the impact of changes in both the EU and Irish economies on domestic government finances. The report explains that the current government policy-making position is a risk averse one of ‘no regrets’. Although not necessarily resulting in the ‘optimal’ policy option being selected, this approach should result in policy options which lead to generally positive outcomes across a range of possible scenarios being selected / implemented. This is necessary given the current tenuous position of the Irish economy to withstand any additional shocks, as well as the high level of uncertainty in the economic environment both locally and more broadly in the EU and worldwide.
The ESRI report includes estimates of GNP growth rates in the medium term (2015 to 2020) under three recovery scenarios, ranging from stagnation to recovery. See table below for summary of GNP growth under the three scenarios.
|
% GNP Change per year |
|||||||||
| Scenario |
2012 |
2013 |
2014 |
2015 |
2016 |
2017 |
2018 |
2019 |
2020 |
| Recover |
3.3 |
1.2 |
0.5 |
4.3 |
3.6 |
4 |
3.4 |
3.2 |
3.6 |
| Delayed adjustment |
3.3 |
1.3 |
-0.9 |
3 |
1.1 |
2.8 |
3.1 |
– | – |
| Stagnation |
3.3 |
1.2 |
0 |
1.9 |
0.6 |
2.1 |
0.4 |
0.9 |
1.7 |
This report provides an ideal source for the proxy wage growth estimates, as it takes into account many aspects of economic recovery you might not have considered. For the calculation of productivity losses associated with cancer in Ireland, you could use the wage growth rate based on the forecast GNP growth rate from the recent ESRI report. You can use the Delayed Adjustment scenario as the base case, with the Recovery and Stagnation scenarios providing upper and lower bounds for sensitivity analysis.
Extra considerations: If using this, you need to be aware of a number of considerations:
- You could calculate the growth adjustment per year for each year of lost productivity, or use the average of the annual % change for the years 2015 – 2030. For my work, the changes between years are less important, and I will use the average.
- The wage growth rate may not be consistent with reports of other improvements in the economy, making GNP growth a poor proxy. This was well described in the Wall Street Journal article mentioned earlier, which discusses how the current pattern of economic recovery in the US is masking consistently low real wage growth rates. In this case, you must weigh up using current real wage growth (which may not hold for the future) against using a potentially poor proxy but which has been projected to take account of the changing economic environment. For my research, I believe that the uncertainty around economic recovery scenarios is more important than the potential difference between actual wage growth and the proxy value, so I am going to use the projected GNP growth.
- As with any projection or forecast or prediction, it is almost certainly wrong! So you need to carefully consider the uncertainty around the estimates and how they might influence your results.
Overall, this is a difficult economic time to be trying to make forecasts, however the very useful report from ESRI gives a good platform on which to form a base case and sensitivity analysis. And remember, the most important component of choosing a growth rate (or any assumption in your model) is to have a justification for your choice of methods and sources.